(Some rambling discussion and one new picture at mandelbrot-d.html.)
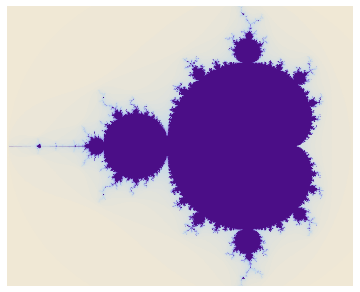
Mandelbrot set:
![]()
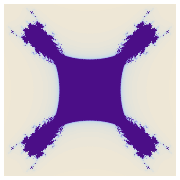
Mandelbar set:
![]()

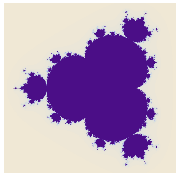
Mandelbrot(3) set:
![]()

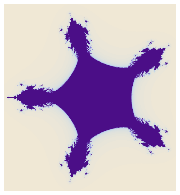
Mandelbar(3) set:
![]()
Mandelbrot(4) set:
![]()
Mandelbar(4) set:
![]()
Following is the code for the Mandelbrot set (in short, for a 175-by-175 grid of complex numbers c (written as x + i y here) values from -2.01 - 1.1i to 0.7 + 1.1i, we iterate z → z2 + c until |z| > 2 or we’ve gone through 50 iterations):
DensityPlot[
  -Length[
     FixedPointList[ #^2 + (x + I y) &, x + I y, 50,
       SameTest->(Abs[#2] > 2.0 &) ]],
  {x, -2.01, 0.7}, {y, -1.1, 1.1},
   PlotPoints -> 175, Mesh -> False, Frame -> False,
   AspectRatio -> Automatic ];
For the other pictures, change #^2 to #^3, etc., or to Conjugate[#]^3, etc. In Mathematica 3.0 we can make the function more than five times faster by compiling the iteration function. Here’s the compiled version (which I haven’t actually tried since 1997):
cMandelbrot =
   Compile[{{c, _Complex}},
     -Length[
       FixedPointList[#^2 + c &, c, 50,
         SameTest -> (Abs[#2] > 2.0 &)]]];

ListDensityPlot[
  Table[cMandelbrot[a + b I],
    {b, -1.1, 1.1, 0.0114}, {a, -2.0, 0.5, 0.0142}],
 Mesh -> False, AspectRatio -> Automatic, Frame -> False];
Designed and rendered using Mathematica 2.2 for the Apple Macintosh and (much, much later) 7.0 for Microsoft Windows.
M-notation and general inspiration lifted long ago from Alexander, Giblin, and Newton, “Symmetry Groups of Fractals”, The Mathematical Intelligencer, vol. 14, no. 2, Spring 1992.
© 1996–2026 Robert Dickau
[ home ] || [ 1996-??-?? ]
www.robertdickau.com/mandelbrot.html